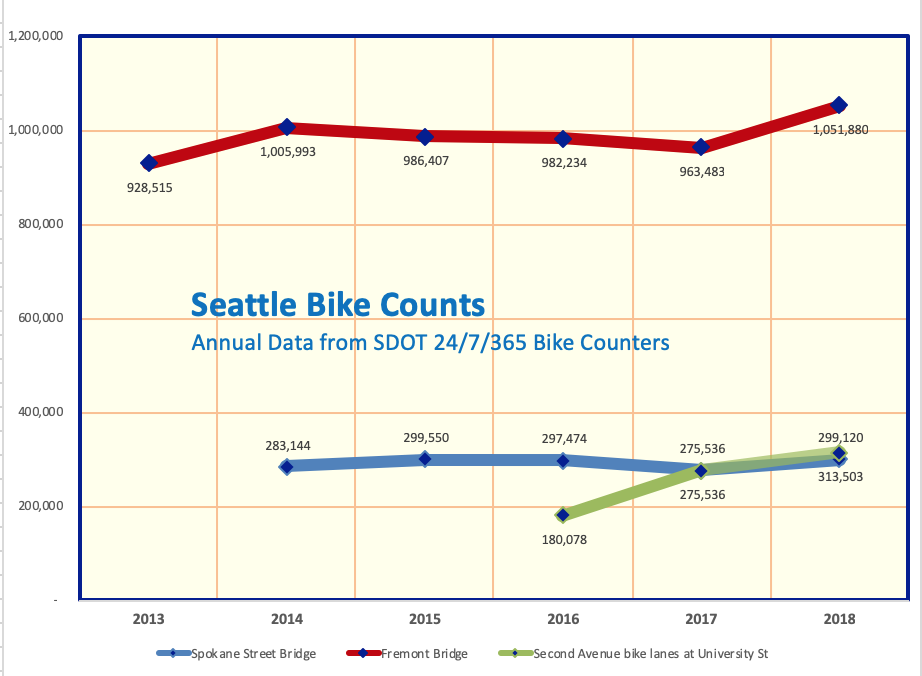
Here are counts of actual bike trips at key locations in Seattle where SDOT has permanent full time bike counters. Fremont Bridge, Spokane Street Bridge, and Second Avenue protected bike lanes near University Street. Contrary to recent news reports, you can see that the numbers have been fairly even over the last few years at the bridges, and went way up on Second Avenue after the second phase was completed.
The SDOT bike counters count real people actually using bikes, for all kinds of purposes. The Second Avenue data is interesting. It shows what happened very quickly when the City actually made a big change on just one downtown street to prioritize safety, and permitted dockless bike share, too.
The erroneous news stories reporting that bike riding went down by some big percentage in 2017 in Seattle were based on a small sample of people answering a US Census American Community Survey question on what their single primary mode of commuting was. They did not actually count any bike riders on the streets. They just sampled a few people, and their question missed all those who use a bike for just part of their commute, or part of the time.
The numbers are from SDOT. We added up the monthly data for each year. The graphs are ours, as are any errors.
We adjusted 2018 data for the Spokane Street Bridge to account for 6 days lost in June to emergency bridge closure, 3.5 days in November due to copper cable theft, and 9 days in December due to another copper cable theft. Adjustment was made by interpolation from nearest weekday and weekend days to those events. Counts even without those 18.5 days were higher than 2017 by 3.5%. This counter is still out. A temporary hose counter in place. Of course, due to the federal government shutdown, the US Census Bureau is not working either.